Week-End 1: No rest for the wicked!
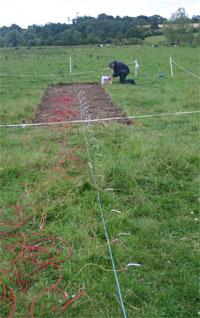
No, I’m not telling you how much washing I had to do after the first week or how long I slept for. In fact, although the team had both days off over the week-end, Kevin and Mark of Landscape & Geophysical Survices came down to the site with me to do some geophysical surveying on Saturday (in spite of the very persistent, and sometimes heavy, rain). There were a number of questions to be followed up on and pieces of work to be done. Firstly, we needed to carry out an electrical resistance tomography (ERT) survey over the line of Trench 4 before it is excavated. This had been done previously along the bank where Trenches 1 and 3 are located. This is a little used but very useful technique because, unlike other more conventional geophysical survey methods like magnetic gradiometry or earth resistance which produce map-like plots, and ERT survey produces a section along a line, so it takes a vertical slice downwards across the line chosen. If you are planning to excavate a series of substantial cut features like ditches, this is an ideal technique as it lets you know exactly where the feature is located and it also gives an indication of its depth. Very useful information if you are trying to budget out how long a job might take. An electrical signal is sent down into the soil which is reflected back upwards. The signal is distorted depending on the depth and the nature of the obstacles encountered.
For those of you interested in the technical details of the technique, ERT uses a series of electrodes to pass an electric current into the ground and measure a resulting voltage. Using the values of current and voltage a resistance can be calculated using Ohm’s Law. The depth of penetration of the current is a function of the spacing of the electrodes, the wider the spacing the deeper the current flow. By selectively increasing the electrode separation the resistance of the sediments existing from the ground surface to greater depths can be measured. In order to compensate for the increasing electrode separation each resistance value is multiplied by a factor based on the electrode spacing and it becomes a resistivity. The resistivities are then plotted on a pseudosection which represents the distribution of resistivity with depth. In order to relate the overall resistivity distribution to the individual resistivities of host sediments and possible buried archaeological features such as ditches and walls the resistivity values in pseudosection are subjected to a computer modeling process. This process results in a more realistic model or section of the surface which then can be interpreted in terms of the possible archaeology intersected by the section.
In the case of Trench 4 we are trying to locate the outer ditch seen in the magnetic gradiometry data. The ditch can be seen as a lower resistivity feature about 9m along the section. The lower resistivity represents the fill of the ditch. Underneath the ditch is even lower resistivity and we are wondering if this is due to clays laid down by the River Boyne and/or water saturated sediments. The excavation may reveal the answer to this question.
The next job we had to do was to trace the full length of the outer enclosure. Earlier survey work had established that this feature continued from the tillage field into the pasture field to the east (where Trench 4 is located). However, we had yet to fully map its entire length. Mark did this using a magnetic gradiometer, the same kind of instrument that had been used previously. This detects minute distortions in the earth’s magnetic field caused by the properties of the soils close to ground surface. Archaeological features like fireplaces and the fills of pits and ditches often contain soils and materials that will affect the earth’s magnetic field and these very sensitive instruments are capable of detecting these changes. This survey was successful and, although there had been a lot of disturbance of archaeological features by later cultivation, the line of the ditch was detected traveling eastwards to meet the riverbank where we guessed it would.
We also took the opportunity to carry out a survey with another technique: ground penetrating radar (GPR). This technique works like an ERT survey. A signal (in this case radar, a type of radio wave) is sent downwards into the ground and is reflected back to the surface by different materials. The nature of the reflected signal received on the surface by the unit can tell about what it is (hard, soft, void) and its depth. Thus a vertical slice, like with ERT, is obtained. However, when a series of parallel lines is surveyed, and the data are downloaded and processed with the appropriate software, we end up with a 3-D model of the sub-surface archaeology of the survey area.
We look forward to seeing the results of this one and depending on the success of the survey and the quality of the survey, I’ll give you a look too. Watch this space!
This entry was posted on July 12, 2010 by Conor Brady. It was filed under Archaeology, Excavation, ireland, neolithic, River Boyne and was tagged with archaeological techniques, Archaeology, Brú na Bóinne, Electrical resistance tomography, Excavation, ground penetrating radar, Ireland, magnetic gradiometry, Rossnaree archaeological dig, Rossnaree dig.
Comments are closed.


